QEDDecoderMetric Case Study
In the early
development of QEDDecoderMetric,
a functional decoder was required to fully exercise the capabilties of
the test suite. After some investigation, the open-source package ZBar was
chosen to act as the
test decoder.
Visiting the above link, downloading version 0.10 of the source code, and integrating it into QEDDecoderMetric, the source compiled with no changes. Running a small database of a few dozen Code 39 images resulted in zero decodes. After QEDDecoderMetric generated hundreds of additional images, then a small handful decoded.
With the decoder now working, the full set of 19 sensitivity tests was run on the Code 39 sample barcode. The resulting full set of graphs can be seen here.
To interpret the graphs, a red dot indicates the presence of a misdecode - an incorrectly decoded result. A large green dot indicates a large percentage (greater than 95%) of barcodes with the given parameters decode. A medium sized green dot indicates a medium percentage (50% - 95%) of barcodes with the given parameters decode. A small green dot indicates a low percentage (10% - 50%) of barcodes with the given parameters decode. The absence of a green dot indicates that fewer than 10% of those barcodes decode.
The set of graphs contains a large amount of information. What is clear, is that for the majority of the graphs, decode strength is weak, as is evidenced by small dots or no dots in most locations.
Upon examining the graphs, three clearly show that there exist conditions under which the decoder is able to decode well: Blur vs SNR, SNR vs SNR Balance, and White vs MRD. Examination of these three graphs will yield some significant insights.
Please note that the red dots (indicating misdecodes) have been removed from the following graphs as they will only serve as a distraction at this point in time.
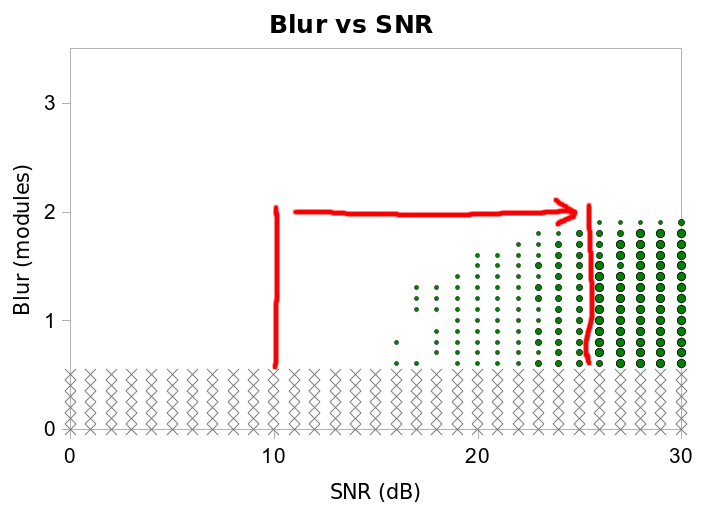
The purpose of the above graph is to diplay the relationship that SNR
and blur values have on the ability of a given image to be decoded.
The graph tells a valuable story. Given that all of the large dots are to the right of the rightmost red line, this means that the decoder is only able to decode images with SNR values of 26 dB and greater.
As most decoders are able to decode in the presence of SNR values of approximately 10 dB or greater (a level corresponding to the leftmost red line), we now conclude that ZBar is very sensitive to noise.
Furthermore, all of the other sensitivity tests that do not have SNR as one of its axes use an SNR value of 20 dB, which corresponds to the expected noise level of an average quality image. Given that the above graph demonstrates that a level of 20 dB is on ZBar's threshold of decodability, it is now of little surprise that most graphs demonstrate weak decoding.
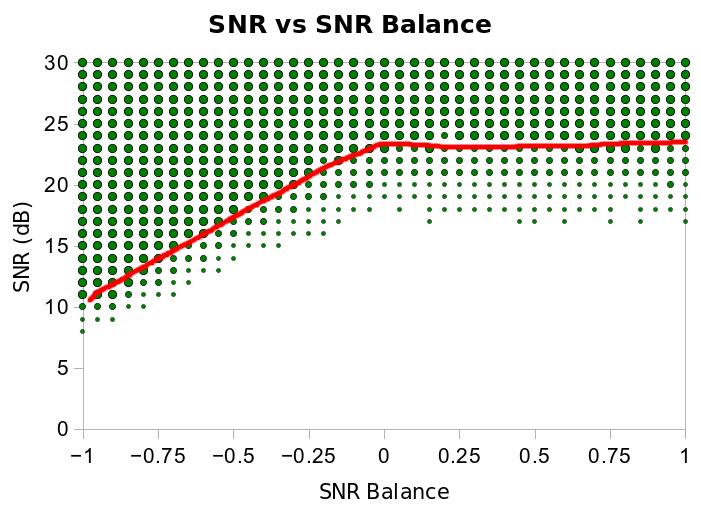
The purpose of the above graph is to demonstrate the decoder's
sensitivity
to conditions where the noise is primarily present in the black areas
of the image (negative values of balance), or white areas of the image
(positive values).
To interpret the graph, an SNR balance of zero indicates that noise is present in equal amounts in both the black and white areas of the image. A balance value of negative one represents the case where only black areas have noise, while the white areas are noiseless. A balance value of positive one represents the case where only white areas have noise, while the black areas are noiseless.
What is evident, is that the decoder is very sensitive to noise in the white areas of the image.
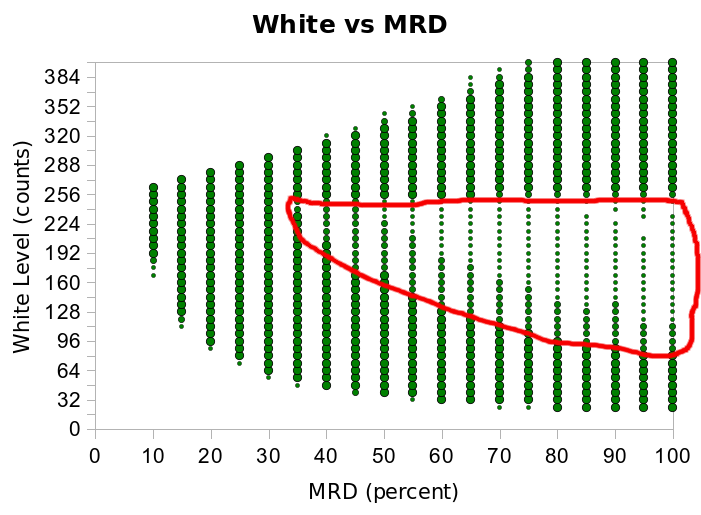
The purpose of the above graph is to demonstrate the decoder's ability
to decode images with various brightness and contrast levels with a
fixed noise level of 20 dB.
The graphs shows a characteristic that is usually indicative of a weakness in a decoder. In this case, we have a region of large dots, corresponding to a high probability of decode. However, inside of this region, there exists an area of lower probability of decode, namely that area within the red outline.
Note that the White vs MRD graph shows that even at an SNR value of 20 dB, decoding is possible for darker images (lower white levels), lower contrast images (lower MRD), and saturated images (white levels in excess of 255).
The fact that saturated images decode well should be expected given the SNR balance will be negative in these cases (noise only present on black elements as white elements saturate at 255).
The common characteristic of darker images and lower contrast images is that the absolute magnitude of the noise is lower. This would tend to imply that once noise (in particular, noise on white) exceeds a fixed threshold, decoding is not possible.
Examining the source code, it was found that a fixed-value minimum edge size was used to indicate the presence of an edge. The code was modified to use a two pass algorithm where the minimum edge size is set to a fixed ratio of the maximum edge size, with a fixed minimum (equal to the original threshold).
The full set of graphs after having applied the candidate fix can be seen here. It is readily evident that the decode rate of the proposed modification is significantly better than the original code.
While it is clear that the decode performance has been greatly improved, there exist a number of remaining deficiencies.
Misdecodes
Roll angles other than vertical and horizontal
Blur limit
PPM limit
SNR limit
Margin
While there exist other shortcomings, the preceding list is a good starting point for tuture improvements to the ZBar decoder.
Visiting the above link, downloading version 0.10 of the source code, and integrating it into QEDDecoderMetric, the source compiled with no changes. Running a small database of a few dozen Code 39 images resulted in zero decodes. After QEDDecoderMetric generated hundreds of additional images, then a small handful decoded.
With the decoder now working, the full set of 19 sensitivity tests was run on the Code 39 sample barcode. The resulting full set of graphs can be seen here.
To interpret the graphs, a red dot indicates the presence of a misdecode - an incorrectly decoded result. A large green dot indicates a large percentage (greater than 95%) of barcodes with the given parameters decode. A medium sized green dot indicates a medium percentage (50% - 95%) of barcodes with the given parameters decode. A small green dot indicates a low percentage (10% - 50%) of barcodes with the given parameters decode. The absence of a green dot indicates that fewer than 10% of those barcodes decode.
The set of graphs contains a large amount of information. What is clear, is that for the majority of the graphs, decode strength is weak, as is evidenced by small dots or no dots in most locations.
Upon examining the graphs, three clearly show that there exist conditions under which the decoder is able to decode well: Blur vs SNR, SNR vs SNR Balance, and White vs MRD. Examination of these three graphs will yield some significant insights.
Please note that the red dots (indicating misdecodes) have been removed from the following graphs as they will only serve as a distraction at this point in time.
The graph tells a valuable story. Given that all of the large dots are to the right of the rightmost red line, this means that the decoder is only able to decode images with SNR values of 26 dB and greater.
As most decoders are able to decode in the presence of SNR values of approximately 10 dB or greater (a level corresponding to the leftmost red line), we now conclude that ZBar is very sensitive to noise.
Furthermore, all of the other sensitivity tests that do not have SNR as one of its axes use an SNR value of 20 dB, which corresponds to the expected noise level of an average quality image. Given that the above graph demonstrates that a level of 20 dB is on ZBar's threshold of decodability, it is now of little surprise that most graphs demonstrate weak decoding.
To interpret the graph, an SNR balance of zero indicates that noise is present in equal amounts in both the black and white areas of the image. A balance value of negative one represents the case where only black areas have noise, while the white areas are noiseless. A balance value of positive one represents the case where only white areas have noise, while the black areas are noiseless.
What is evident, is that the decoder is very sensitive to noise in the white areas of the image.
The graphs shows a characteristic that is usually indicative of a weakness in a decoder. In this case, we have a region of large dots, corresponding to a high probability of decode. However, inside of this region, there exists an area of lower probability of decode, namely that area within the red outline.
Note that the White vs MRD graph shows that even at an SNR value of 20 dB, decoding is possible for darker images (lower white levels), lower contrast images (lower MRD), and saturated images (white levels in excess of 255).
The fact that saturated images decode well should be expected given the SNR balance will be negative in these cases (noise only present on black elements as white elements saturate at 255).
The common characteristic of darker images and lower contrast images is that the absolute magnitude of the noise is lower. This would tend to imply that once noise (in particular, noise on white) exceeds a fixed threshold, decoding is not possible.
Examining the source code, it was found that a fixed-value minimum edge size was used to indicate the presence of an edge. The code was modified to use a two pass algorithm where the minimum edge size is set to a fixed ratio of the maximum edge size, with a fixed minimum (equal to the original threshold).
The full set of graphs after having applied the candidate fix can be seen here. It is readily evident that the decode rate of the proposed modification is significantly better than the original code.
While it is clear that the decode performance has been greatly improved, there exist a number of remaining deficiencies.
Misdecodes
There is a very large number of red
dots on all of the graphs, indicating misdecoded results. In general,
returning an incorrect result is viewed as considerably worse than
returning no result. This is a very serious weakness of the code.
Roll angles other than vertical and horizontal
It is quite evident that ZBar is unable
to decode barcodes unless the bars are precisely vertical or
horizontal.
In many environments, it is not possible to guarantee such orientation,
making this a very serious flaw.
Blur limit
The code, as it stands, is not able to
withstand more than 1.8 modules of blur. Experience has shown that
binary codes are able to withstand 3.0 modules of blur, making the
existing decoder much weaker than competing decoders.
PPM limit
The decoder appears to be unable to
decode barcodes with fewer than 1.1 pixels per module present. It is
known that lower values are reliably decodable.
SNR limit
The decoder appears to experience
difficulties when decoding at SNR levels under 13 dB. Experience
has
shown that levels of 0 dB may be reliably decoded.
Margin
If the margin present is less than 7
modules, the decoder does not decode. While this may be prudent in a
laser-based application, in an image-based one, where full 2D
information is available, a significantly smaller margin may be
reliably used. This is important since not all barcodes are printed
with the required margin.
While there exist other shortcomings, the preceding list is a good starting point for tuture improvements to the ZBar decoder.